Quality Intelligence
Turn every inspection into an operating signal.
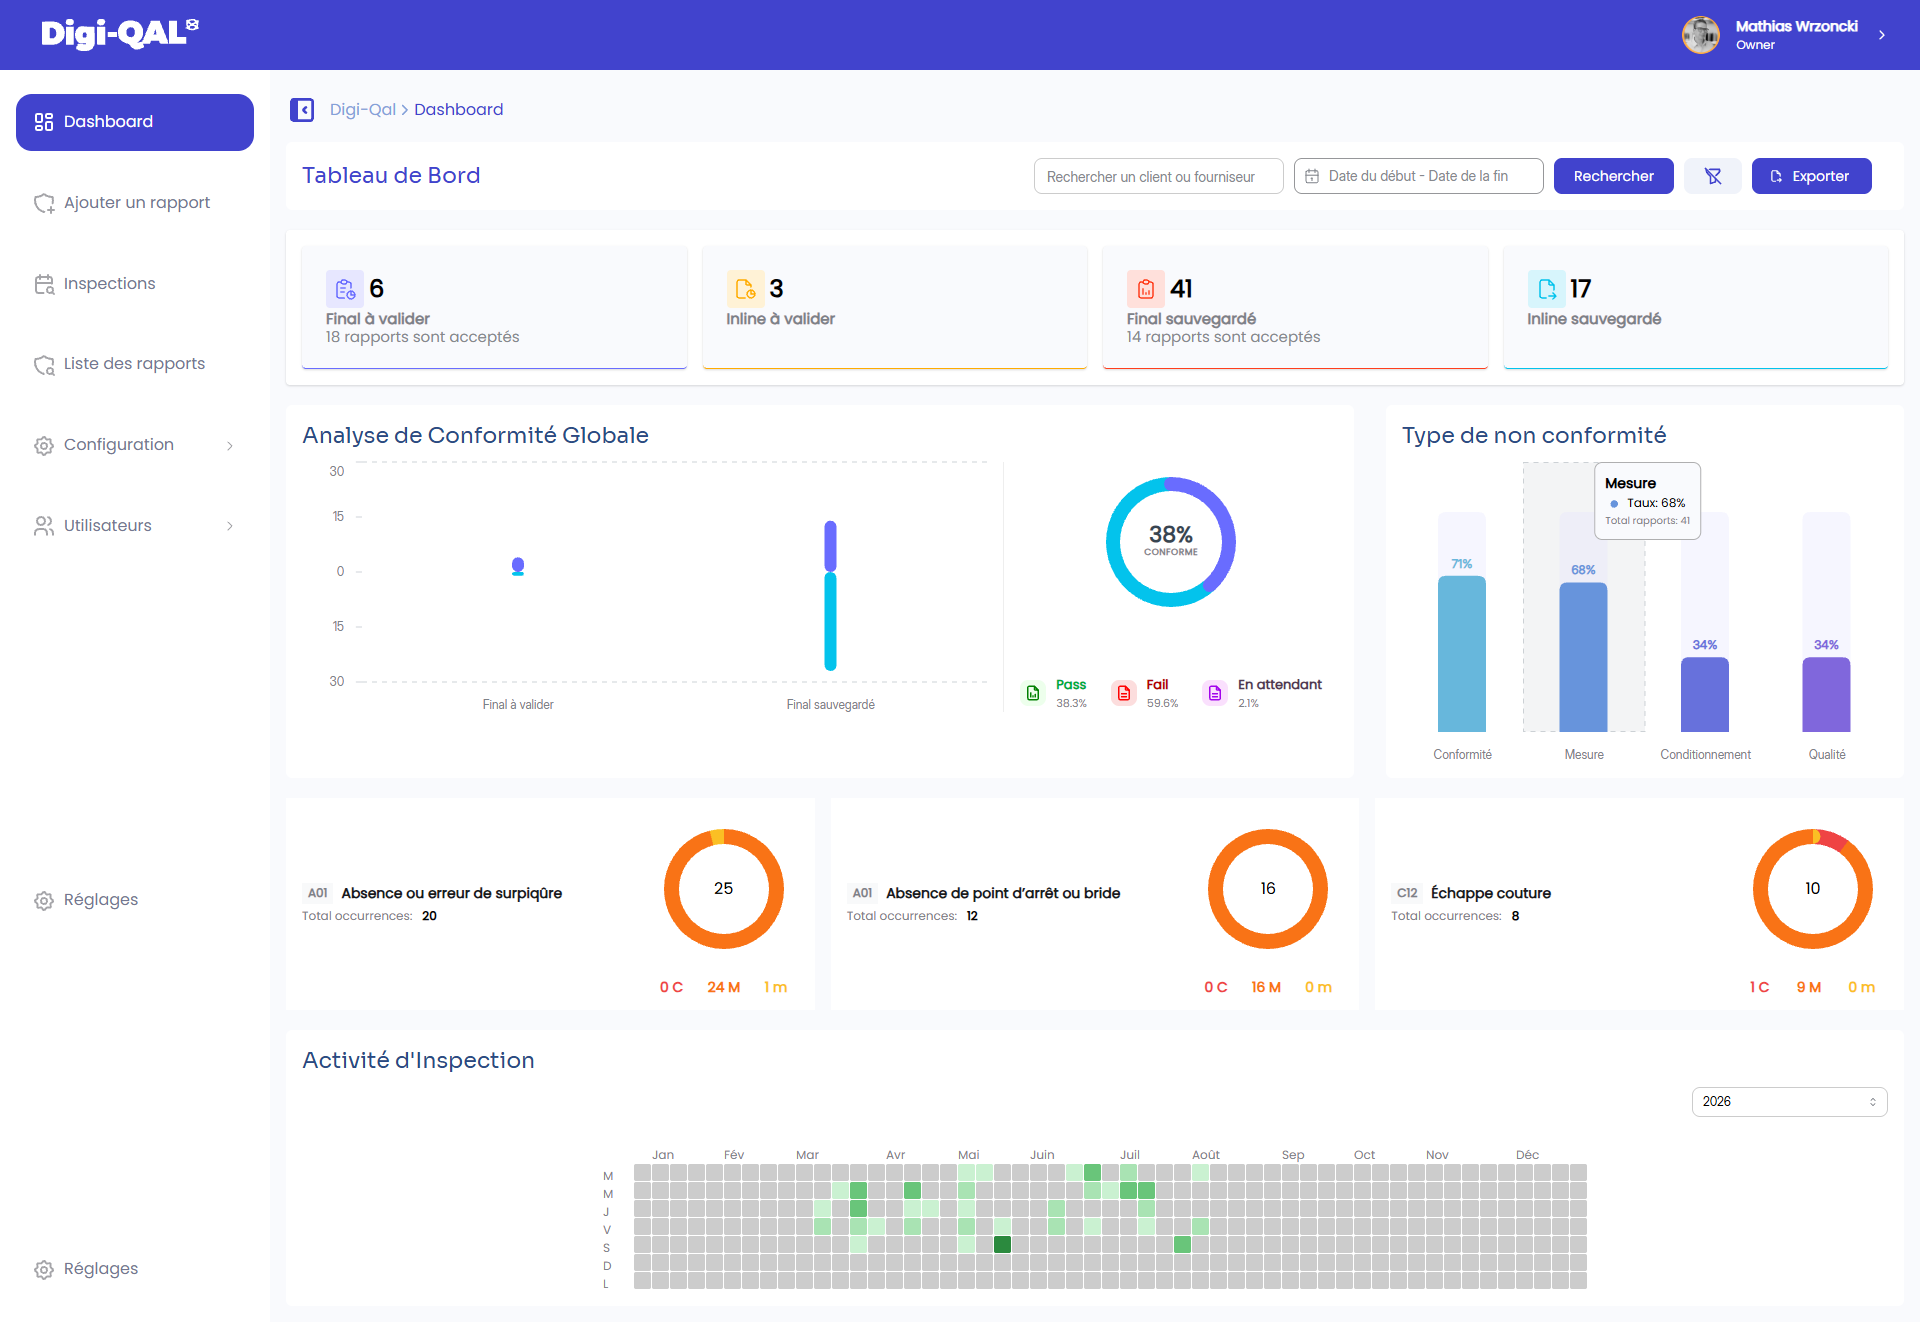
Digi-QAL makes queues, conformity, non-conformity categories, recurring defects and inspection activity visible in one filterable dashboard.
From data to priority
See the queues and the causes together.
The current dashboard links operational workload to three recurring defect cards and a full-year inspection activity calendar.
Missing or incorrect topstitching.
20 occurrences in the visible snapshot.
Missing bar tack or reinforcement.
12 occurrences in the visible snapshot.
Seam slippage.
8 occurrences in the visible snapshot.
AQL Decision Support
Use the same configured threshold in every inspection.
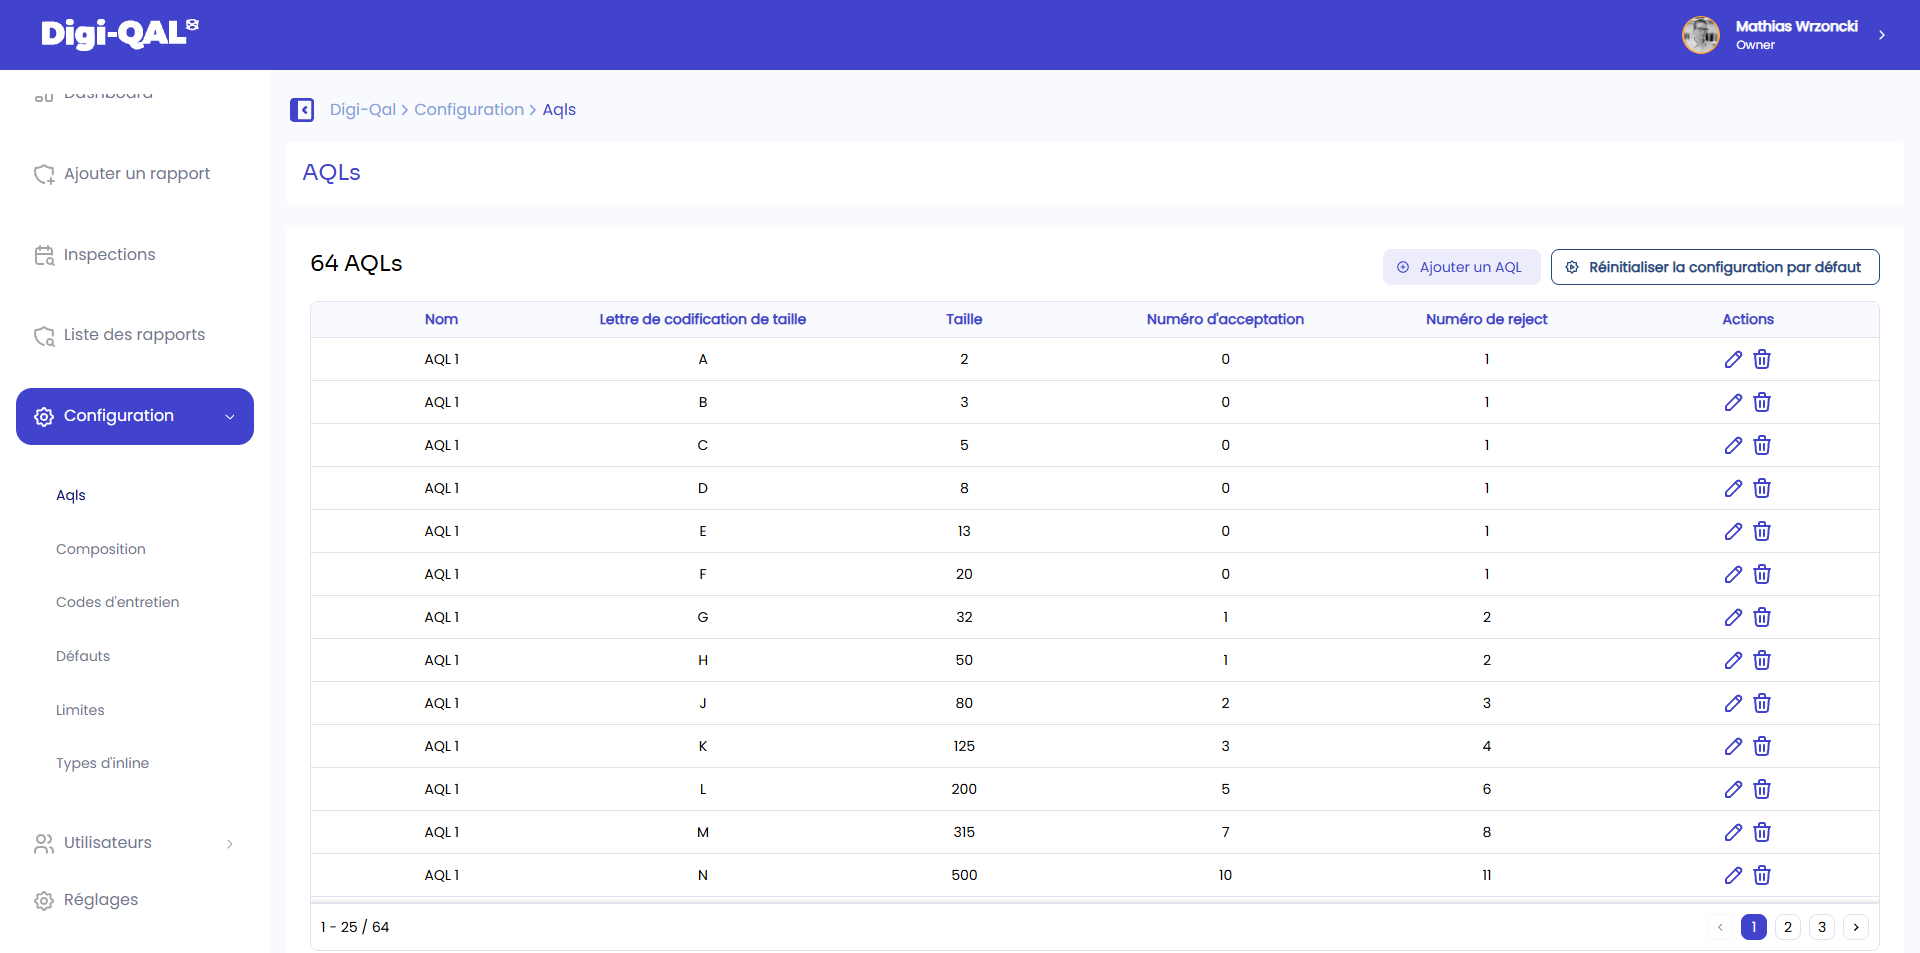
The supplied dashboard contains 64 AQL configurations. Explore the visible AQL 1.0 code-letter table below; the values match the application screenshot exactly.
Configuration sourceAQL 1.0
Code-letter lookup
Sample size32
Accept at1
Reject at2
Decision at the point of work
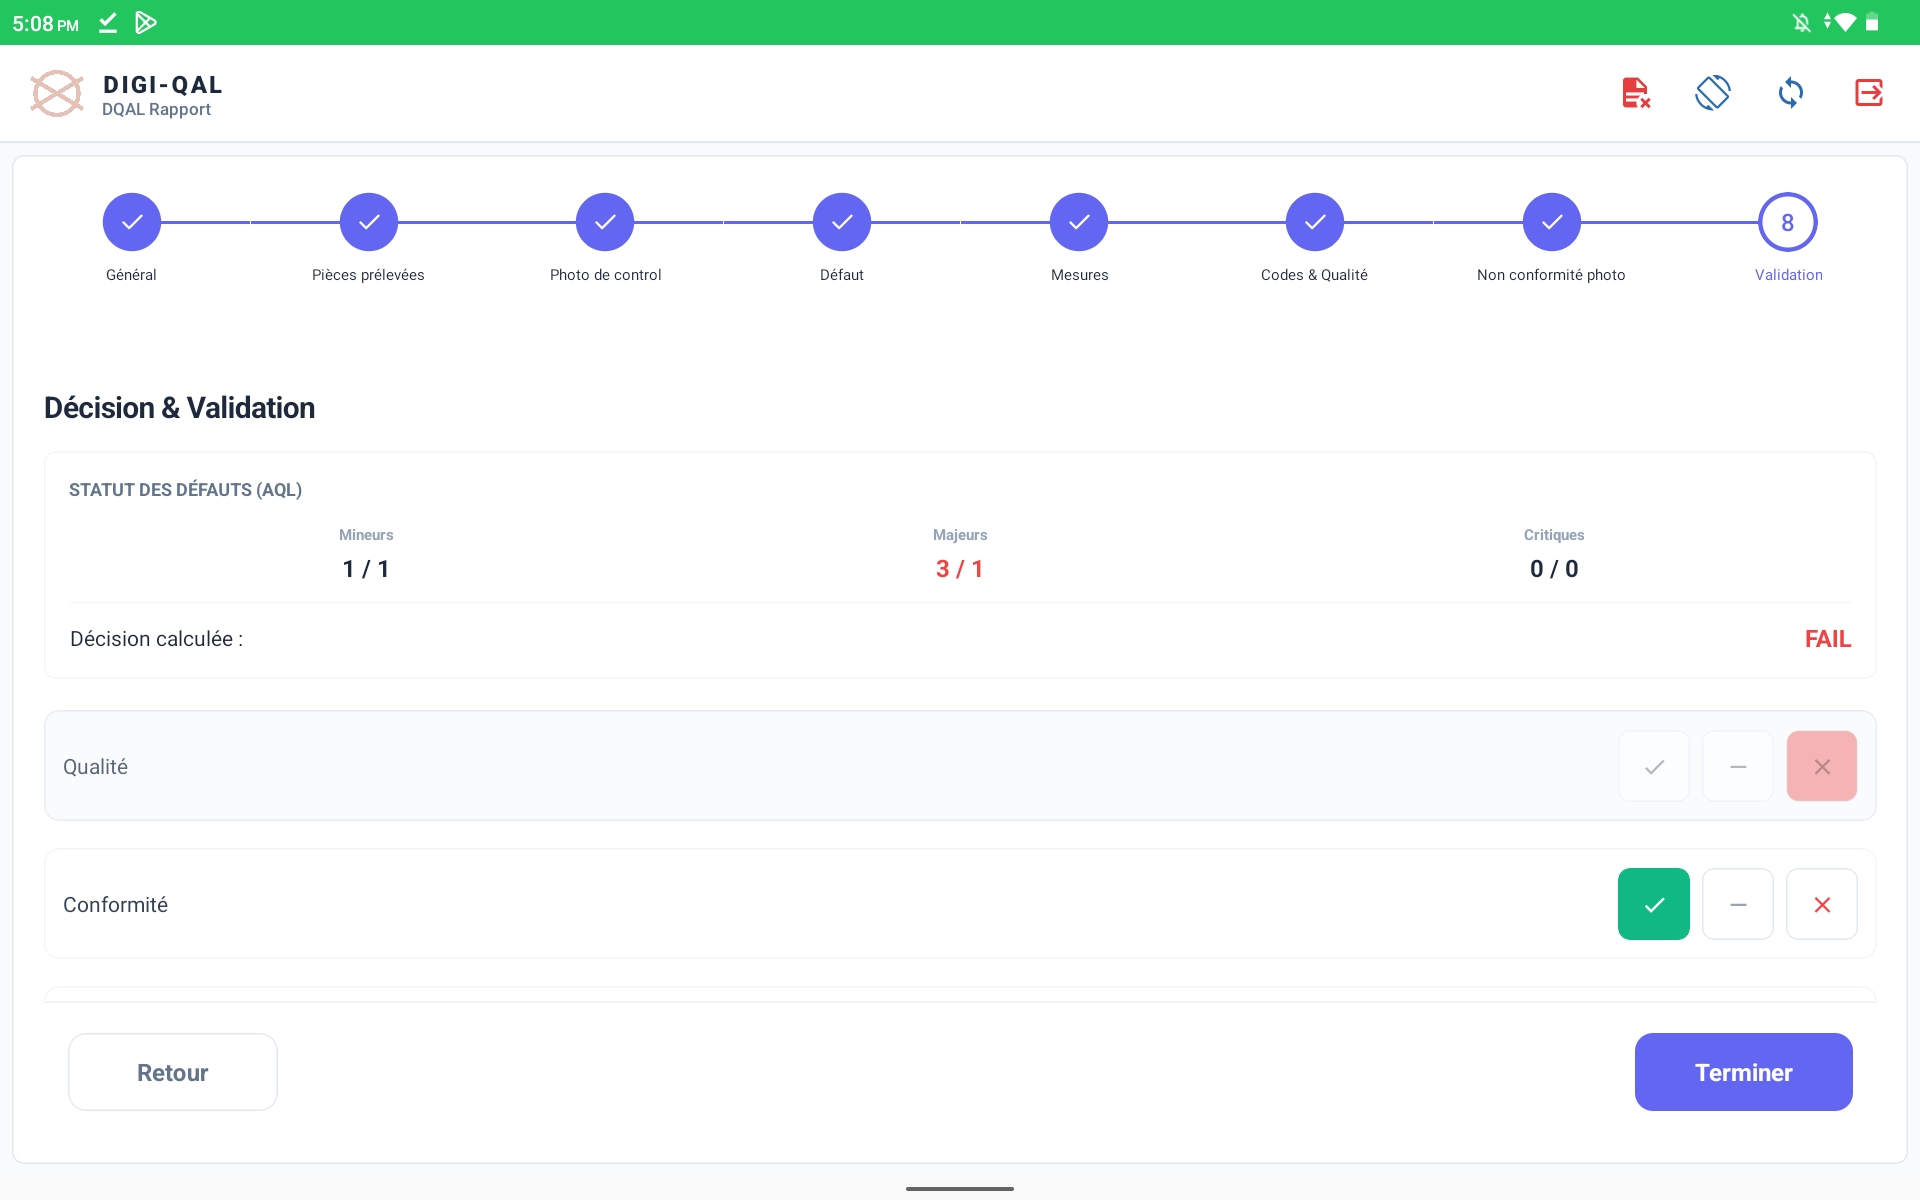
AQL becomes a visible decision, not a separate calculation.
In the supplied final-inspection example, observed major defects exceed the configured limit: 3 observed against 1 allowed. Digi-QAL calculates FAIL before the report is closed.
Supplier benchmarking
Compare your network without exposing it.
Benchmarking is configured inside each customer workspace. Digi-QAL can normalize inspection outcomes, recurring defects, activity and corrective-action status without turning demonstration suppliers into public reference data.
Conformity & AQL decisions.
Compare pass/fail outcomes against the inspection rules approved for your program.
Defect recurrence.
Identify repeated defect codes, severity and affected product categories over time.
Workload & resolution.
Track inspection volume and prioritize records still awaiting review or corrective action.
No supplier identity or score from the demonstration workspace is used here.Map your benchmark model
Your operating perimeter
Structure the data around your own organization.
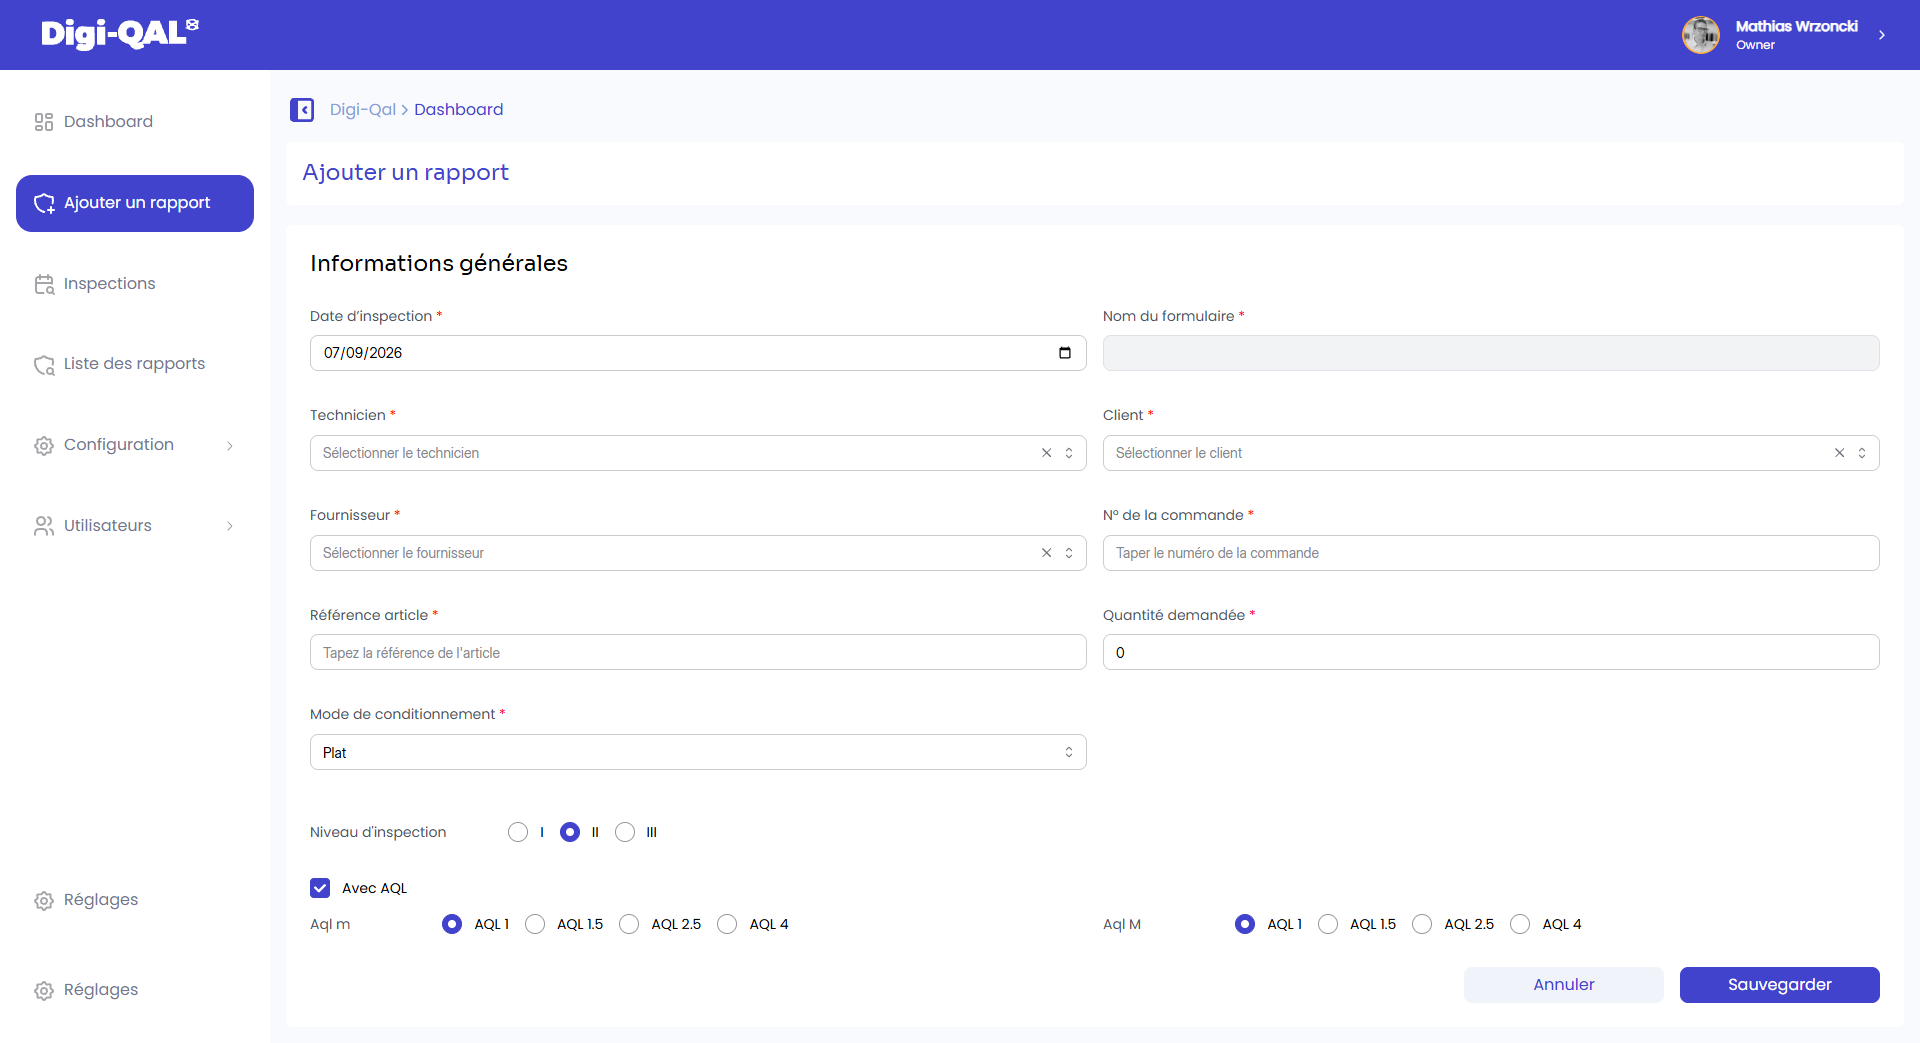
Client, supplier, order, article, report type and inspection date remain operational dimensions—not public identities. Each customer controls the perimeter used for filters, dashboards and reviews.
Quality intelligence for your network
Start with the facts already inside every report.
See how Digi-QAL connects field evidence, AQL and supplier operations without losing the source context.
Book a demo →